Climate & Weather Events — 2006
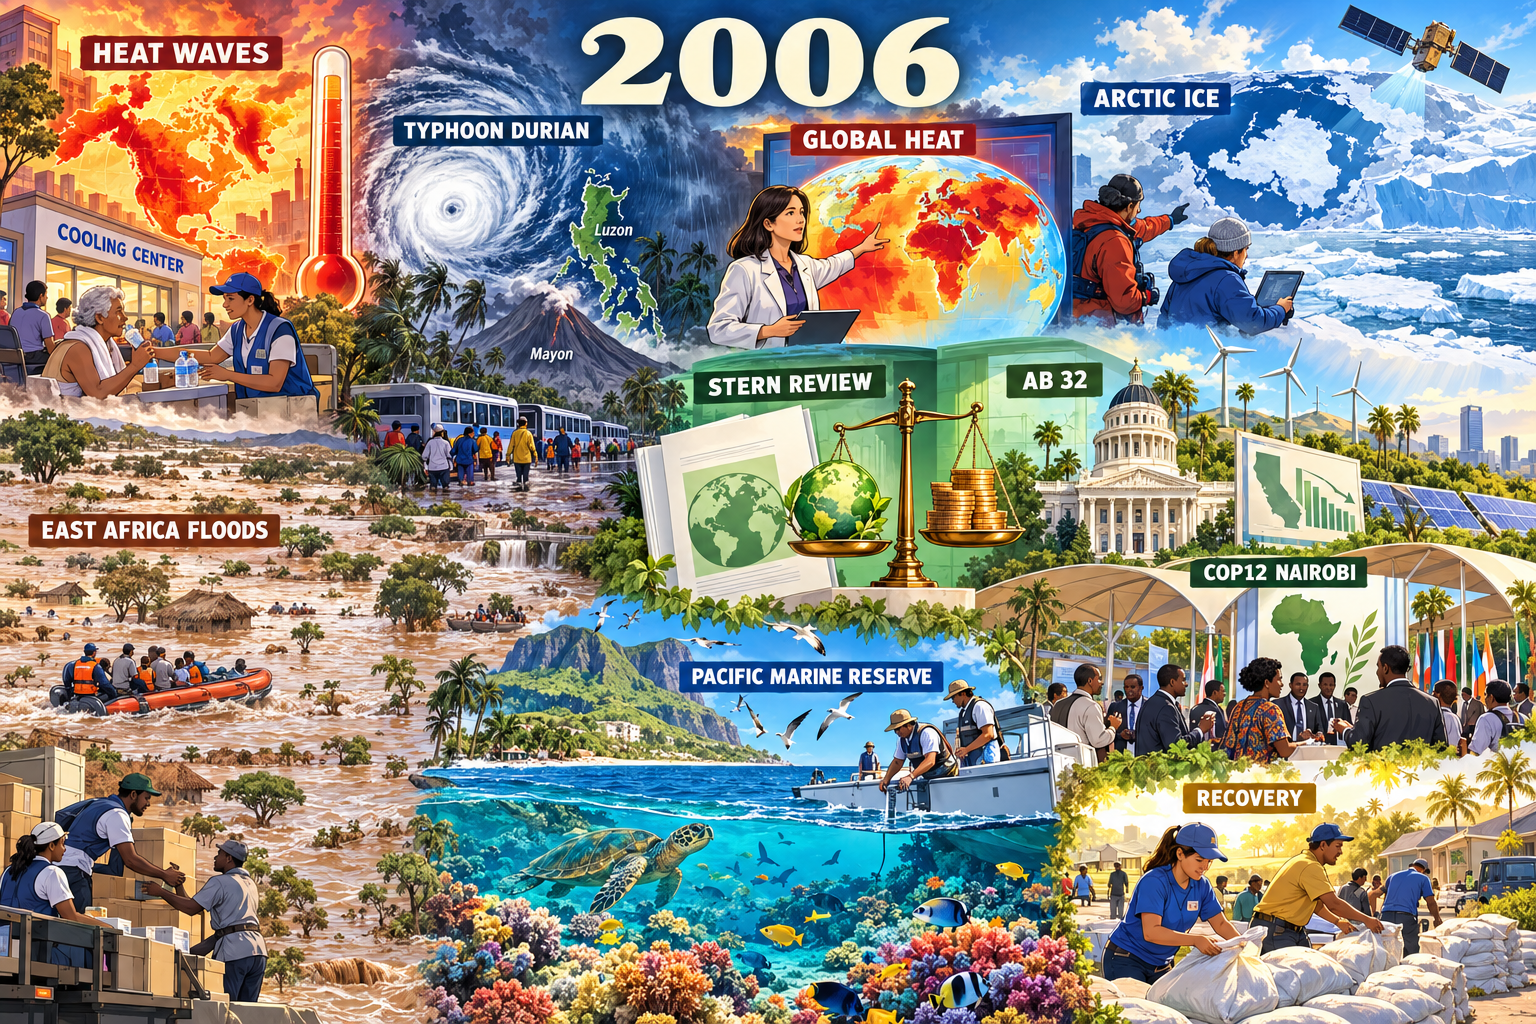
Summer heat waves. A heat map, thermometer, and calm cooling center represent the major 2006 heat episodes without showing victims or asserting a casualty figure.
Climate & Weather Events: 2006
- Year: 2006
- Model: built-in gpt-image
- Generation date: 2026-10-27 (UTC)
- Saved image:
My-Library/Images/Collections/Climate-Weather-Events/Images/Climate-Weather-Events_2006.png
Selected moments, reasons and sources
- Summer heat waves. A heat map, thermometer, and calm cooling center represent the major 2006 heat episodes without showing victims or asserting a casualty figure. Source: https://www.ncei.noaa.gov/access/monitoring/monthly-report/national/200607
- Typhoon Durian / Reming. A storm spiral over Luzon, heavy rain around Mayon, and orderly evacuation buses represent the late-2006 Philippine disaster without bodies, injuries, or damage totals. Source: https://www.metoc.navy.mil/jtwc/products/atcr/2006atcr.pdf
- East African floods. Swollen rivers, rescue boats, supply crews, and sandbagging represent the severe regional flooding that followed drought conditions. Source: https://reliefweb.int/report/ethiopia/horn-africa-floods-update-8-december-2006
- High global temperature. A meteorologist and anomaly globe represent NOAA's annual global climate assessment for 2006; the image intentionally prints no ranking or numerical anomaly. Source: https://www.ncei.noaa.gov/access/monitoring/monthly-report/global/200613
- Low Arctic sea ice. Researchers, a satellite, and a schematic extent map represent the continuation of the multi-year decline and low summer ice conditions. Source: https://nsidc.org/data/seaice_index
- The Stern Review. An open report and a scale balancing a green globe against coins represent the influential economic review released in October 2006. Source: https://www.lse.ac.uk/granthaminstitute/publication/the-economics-of-climate-change-the-stern-review/
- California AB 32. A generic statehouse, wind turbines, solar panels, and a declining emissions chart represent the Global Warming Solutions Act of 2006. Source: https://ww2.arb.ca.gov/resources/fact-sheets/ab-32-global-warming-solutions-act-2006
- COP12 in Nairobi. A generic conference pavilion and Africa map represent the November 2006 UN climate conference and its focus on implementation and adaptation. Source: https://unfccc.int/process-and-meetings/conferences/past-conferences/nairobi-climate-change-conference-november-2006/nairobi-climate-change-conference-november-2006
- Papahānaumokuākea protected. A Pacific reef, seabirds, turtle, and field scientists represent the 2006 creation of the Northwestern Hawaiian Islands Marine National Monument, now Papahānaumokuākea. Source: https://www.papahanaumokuakea.gov/new-news/2006/06/15/monument/
- Response and recovery. Cooling-center staff, evacuation transport, rescue boats, supply distribution, and sandbag crews give adaptation and recovery equal visual weight. This is a respectful synthesis of the hazard sources above.
Balance and tone
Three hazard stories are balanced by temperature and cryosphere science, economic analysis, climate law, international policy, marine conservation, and community response. No casualty, damage, temperature-ranking, or area figures appear in the image. Maps and charts are editorial schematics, not measured reconstructions.
Readable labels
2006; HEAT WAVES; COOLING CENTER; TYPHOON DURIAN; Luzon; Mayon; EAST AFRICA FLOODS; GLOBAL HEAT; ARCTIC ICE; STERN REVIEW; AB 32; COP12 NAIROBI; PACIFIC MARINE RESERVE; RECOVERY.
Final prompt used
Use case: illustration-story. Asset type: Climate & Weather Events collection image. Create a respectful environmental-editorial retrospective for 2006, matching Climate & Weather Events 2003, 2004 and 2005: polished cartoon-editorial science-magazine illustration, clean confident dark linework, soft cel shading, rich painterly digital detail, expressive generic responders and scientists, and geography woven into maps and landscape. One unified continuous landscape flowing from severe weather on the left through climate science and policy to conservation and recovery on the right, not panels or stickers. Large readable ivory year heading “2006” at top center. Nine integrated moments: the deadly European and North American summer heat waves shown without victims through a red-orange temperature map, shaded cooling center and giant thermometer labeled “HEAT WAVES”; Typhoon Durian in the Philippines shown as a satellite storm spiral over a labeled Luzon map, rain-dark Mayon volcano and calm evacuation buses labeled “TYPHOON DURIAN”; flooding in the Horn of Africa shown respectfully with swollen rivers, rescue boats and supply crews labeled “EAST AFRICA FLOODS”; NOAA's global annual climate ranking shown by a meteorologist and warming anomaly globe labeled “GLOBAL HEAT”; continued low Arctic sea ice shown with researchers, satellite and ice-extent map labeled “ARCTIC ICE”; the Stern Review's economic warning shown as an open report, balance scale holding a green globe and coins, labeled “STERN REVIEW”; California's Global Warming Solutions Act shown by generic statehouse architecture, wind turbines, solar panels and an emissions chart labeled “AB 32”; COP12 in Nairobi shown as an open conference pavilion with generic delegates and an Africa map labeled “COP12 NAIROBI”; Papahānaumokuākea Marine National Monument established in 2006 shown as a vibrant protected Pacific reef with seabirds and field scientists labeled “PACIFIC MARINE RESERVE”; community response shown through calm volunteers staffing a cooling center, sandbagging and distributing supplies labeled “RECOVERY”. Make the heat waves, Typhoon Durian, global heat and Stern/AB32 policy shift the largest anchors; give science, policy, conservation and recovery at least equal space to disaster. Storm slate blue, heat orange and red, floodwater brown and volcanic gray balanced by Pacific turquoise, policy green, clear-sky blue and recovery gold. Dramatic weather at left resolves into hopeful clear light at right. Short high-contrast labels only, all spelled exactly; no casualty or damage numbers. STRICT: no gore, bodies, injured people, panic, screaming crowds, disaster-movie spectacle, exact logos, agency seals, national emblems, photorealistic real-person likenesses, fake paragraphs, tiny unreadable labels, watermarks, signatures or borders. Faces must remain visibly illustrated and generic.
QA
Viewed against 2003, 2004, and 2005. Passed: readable year and labels; prominent heat-wave, Typhoon Durian, global-heat, and policy anchors; balanced climate science, policy, conservation, and recovery; calm generic responders; no gore, injury, panic, recognizable real-person likeness, logo, agency seal, watermark, or border. Saved at 1536x1024.
More from Image Collections