Climate & Weather Events — 2009
NASA's January 2010 assessment concerned the completed 2000–2009 decade and described it as the warmest then recorded; this is a historical finding, not a claim about present rankings.
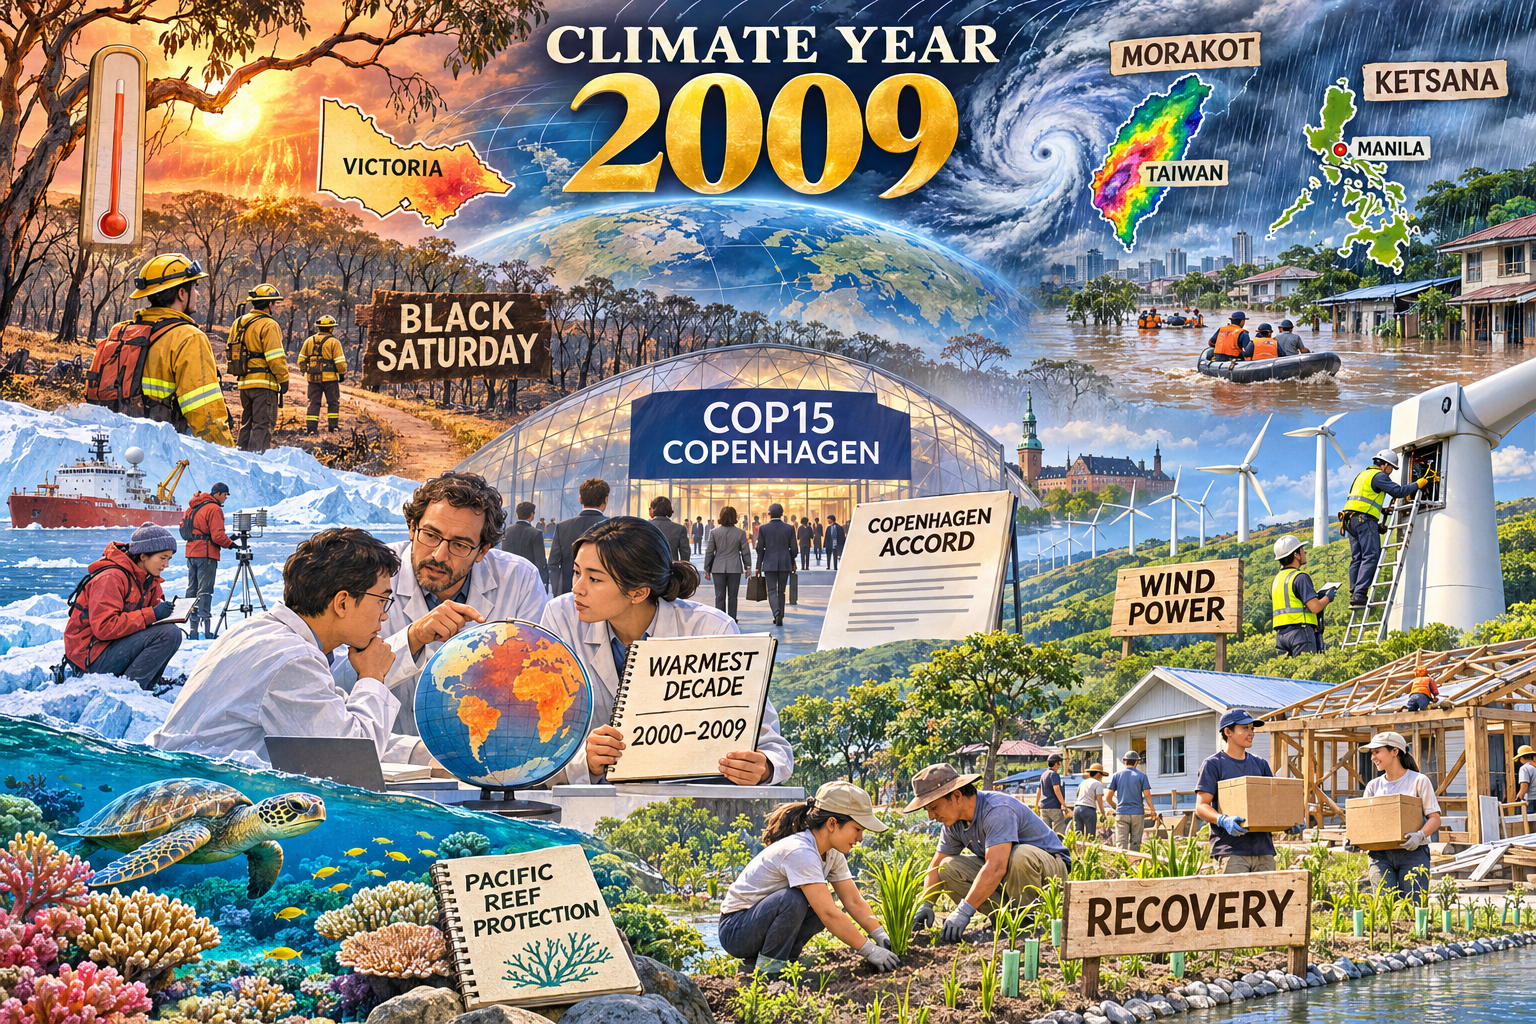
Climate & Weather Events: 2009
- Year: 2009
- Model: built-in gpt-image
- Generation date: 2026-11-07 (UTC)
- Saved image:
My-Library/Images/Collections/Climate-Weather-Events/Images/Climate-Weather-Events_2009.png
Selected moments
| Moment | Why selected / visual depiction | Source |
|---|---|---|
| Southeastern Australian heatwave | Distinctive extreme heat context; Victoria map, haze and unnumbered thermometer | https://www.bom.gov.au/climate/current/annual/aus/2009/ |
| Black Saturday bushfires | Defining Australian disaster; distant scorched eucalyptus and calm firefighters, without casualties or spectacle | https://media.bom.gov.au/social/blog/2025/remembering-black-saturday-the-extraordinary-weather-behind-victorias-2009-bushfires/ |
| Typhoon Morakot | Major Taiwan rainfall and landslide event; Taiwan rainfall map and storm system | https://science.nasa.gov/earth/earth-observatory/slow-moving-typhoon-morakot-inundates-taiwan-39747/ |
| Ketsana / Ondoy flooding | Balances Australian fire with Asian flood hazards; Manila waterline and orderly relief boats | https://documents1.worldbank.org/curated/en/918331468017406040/pdf/689530ESW0P1210ambodia0PDNA020100EN.pdf |
| Warmest decade then recorded | Anchors the page in climate science; globe and scientists' notebook labeled 2000–2009 | https://science.nasa.gov/earth/earth-observatory/2009-ends-warmest-decade-on-record-42392/ |
| COP15 and Copenhagen Accord | Defining international climate-policy debate; meeting pavilion and plain accord document | https://unfccc.int/resource/docs/2009/cop15/eng/11a01.pdf |
| Record US wind capacity additions | Energy-transition counterpoint; turbines and technicians | https://www1.eere.energy.gov/wind/pdfs/2009_wind_technologies_market_report.pdf |
| Pacific Remote Islands Marine National Monument establishment | Conservation milestone; healthy reef and sea turtle | https://georgewbush-whitehouse.archives.gov/news/releases/2009/01/20090106-6.html |
| Community flood and fire recovery | Gives practical response substantial space; unbranded supplies, home repairs and planting as an illustrative composite | https://documents1.worldbank.org/curated/en/918331468017406040/pdf/689530ESW0P1210ambodia0PDNA020100EN.pdf |
Research and tone notes
NASA's January 2010 assessment concerned the completed 2000–2009 decade and described it as the warmest then recorded; this is a historical finding, not a claim about present rankings. No numerical temperature chart is invented. COP15 decision 2/CP.15 took note of the Copenhagen Accord; the image does not claim a binding treaty was adopted. The wind report covers 2009 but was published in 2010. Pacific conservation refers to the original January 2009 establishment, not its 2014 expansion or later name. Black Saturday and the heatwave are related but visually distinct aspects of the same Australian crisis. No individual-event climate attribution is asserted. No disaster death, damage or burned-area figures are used. Recovery figures are generic editorial composites, without injuries, panic, identifiable people, agency marks or seals.
Readable labels requested
2009; BLACK SATURDAY; VICTORIA; MORAKOT; TAIWAN; KETSANA; MANILA; WARMEST DECADE; 2000–2009; COP15 COPENHAGEN; COPENHAGEN ACCORD; WIND POWER; PACIFIC REEF PROTECTION; RECOVERY.
Final prompt used
Use case: illustration-story
Asset type: year-by-year climate and weather events collection image
Primary request: Create a respectful illustrated environmental-editorial montage for the year 2009, showing the extreme weather events, climate-science findings, energy transitions, conservation stories, and environmental policy changes that defined that year.

Scene/backdrop: one cohesive landscape that flows across the frame from weather to response — a sky holding a storm spiral or heat haze seen from above like a weather map, a large wall map with pinned locations, a giant thermometer or temperature-anomaly chart rising through the scene, wind farms and solar fields on a ridge, a flooded street or cracked drought field, a wildfire line with firefighters, scientists with instruments on ice or a research ship, and a neighbourhood rebuilding in the foreground. One unified world, not disconnected stickers.

Subject: combine these selected moments into one unified illustrated montage: the southeastern Australian heatwave, shown by heat haze and an unnumbered thermometer beside a small VICTORIA map; Black Saturday bushfires, shown by distant scorched eucalyptus and calm firefighters on a secure firebreak rather than towering flames; Typhoon Morakot's extreme rain in Taiwan, shown as a clearly separate TAIWAN map with rainfall shading and a storm spiral; Ketsana/Ondoy flooding around Manila, shown by a PHILIPPINES map, brown waterline and orderly unmarked relief boats; NASA's finding that 2000–2009 was the warmest decade then recorded, shown by scientists with a simple globe and a notebook labeled WARMEST DECADE and 2000–2009, not an invented measured chart; COP15 Copenhagen and the Copenhagen Accord, shown by a meeting pavilion labeled COP15 COPENHAGEN and a plain document labeled COPENHAGEN ACCORD, without suggesting a binding treaty; record US wind capacity additions during 2009, shown by onshore turbines and maintenance workers; establishment of the Pacific Remote Islands Marine National Monument, shown by a healthy reef, sea turtle and a plain field notebook labeled PACIFIC REEF PROTECTION; community recovery, shown by calm volunteers repairing homes, distributing plain supply crates and restoring planted embankments. Represent disasters through maps, storm systems, landscapes, and the people responding to them — never through injury or panic.

Year text requirement: include clear readable text in the image that says:
"2009"

Optional title text: include a short readable title such as:
"CLIMATE YEAR 2009"

Style/medium: polished cartoon-editorial illustration in a science-magazine feature style — clean linework, rich painterly detail, infographic touches (map pins, chart lines, isobars), magazine-quality digital art.

Composition/framing: wide landscape image, one unified scene rather than separate panels. Foreground: responders, scientists, and community recovery. Midground: the year's 2-3 defining events, most prominent. Background: weather systems, maps, and charts woven into the sky and landscape.

Lighting/mood: serious but hopeful — dramatic weather light on one side resolving into clear light over recovery and clean-energy scenes.

Color palette: era-aware and event-driven — storm slate blues, heat oranges and reds on the temperature chart, smoke ambers, floodwater browns, drought ochres, balanced by fresh greens and clear sky blues for conservation and renewables. Avoid a one-note palette.

Text constraints: short readable labels are allowed on maps, charts, signs, and instruments. Use 1-5 words per label. Keep text high-contrast, correctly spelled, and large enough to read. Do not use long captions, fake paragraphs, or a row of labels at the bottom.

Avoid: gore, bodies, injured people, panic or screaming crowds, disaster-movie spectacle, exact logos and agency seals, photorealistic likenesses of real people, hateful symbols, cluttered sticker-collage layout, tiny unreadable labels, distorted lettering, fake full article text, watermarks, signatures, borders, and generic stock imagery.

Match the 2007 and 2008 siblings: detailed painterly cartoon-editorial science illustration, clean linework, large gold year at upper center, seamless atmospheric transitions, coherent landscape depth and polished finish. Output landscape 1536 by 1024 pixels. Keep 2009, BLACK SATURDAY, VICTORIA, MORAKOT, TAIWAN, KETSANA, MANILA, WARMEST DECADE, 2000–2009, COP15 COPENHAGEN, COPENHAGEN ACCORD, WIND POWER, PACIFIC REEF PROTECTION and RECOVERY short, readable and correctly spelled. Place each label on its own relevant scene object rather than a bottom caption strip. The largest anchors are Black Saturday, Morakot and Copenhagen, with more than one-third devoted to science, conservation, energy and recovery. Geographically separate labeled schematic maps for Taiwan, Philippines and Victoria, no invented merged coastlines. No measured chart axes or invented statistics. No cross emblems, medical emblems, official seals, agency marks or national flags. Unmarked boats and plain supply boxes. Distant fire damage only, no disaster spectacle. Clean energy scenery should emphasize wind, not invent a solar milestone. Map overlays and the global landscape are editorial composites, not literal neighboring geography.
Visual QA
Viewed against 2007 and 2008 siblings. Passed: readable gold 2009, matching detailed painterly editorial finish and landscape framing; Black Saturday, Morakot and Copenhagen are prominent; wind, climate science, marine conservation and recovery occupy substantial space; labels are short and correctly spelled; generic calm responders, no visible gore, injuries, panic, recognizable real people, official agency seals or identifiable official logos. A small abstract mark appears on the turbine housing but is not an identifiable brand logo. The globe is a schematic warming illustration, not measured temperature data. Polar fieldworkers and a research ship are generic climate-science background, not an additional claimed 2009 breakthrough. Maps and distant city architecture are schematic editorial composites. Saved non-empty at 1536x1024. Built-in output copied from the exact tool-reported path; no recovery or Gemini fallback used.
More from Image Collections