Climate & Weather Events — 2003
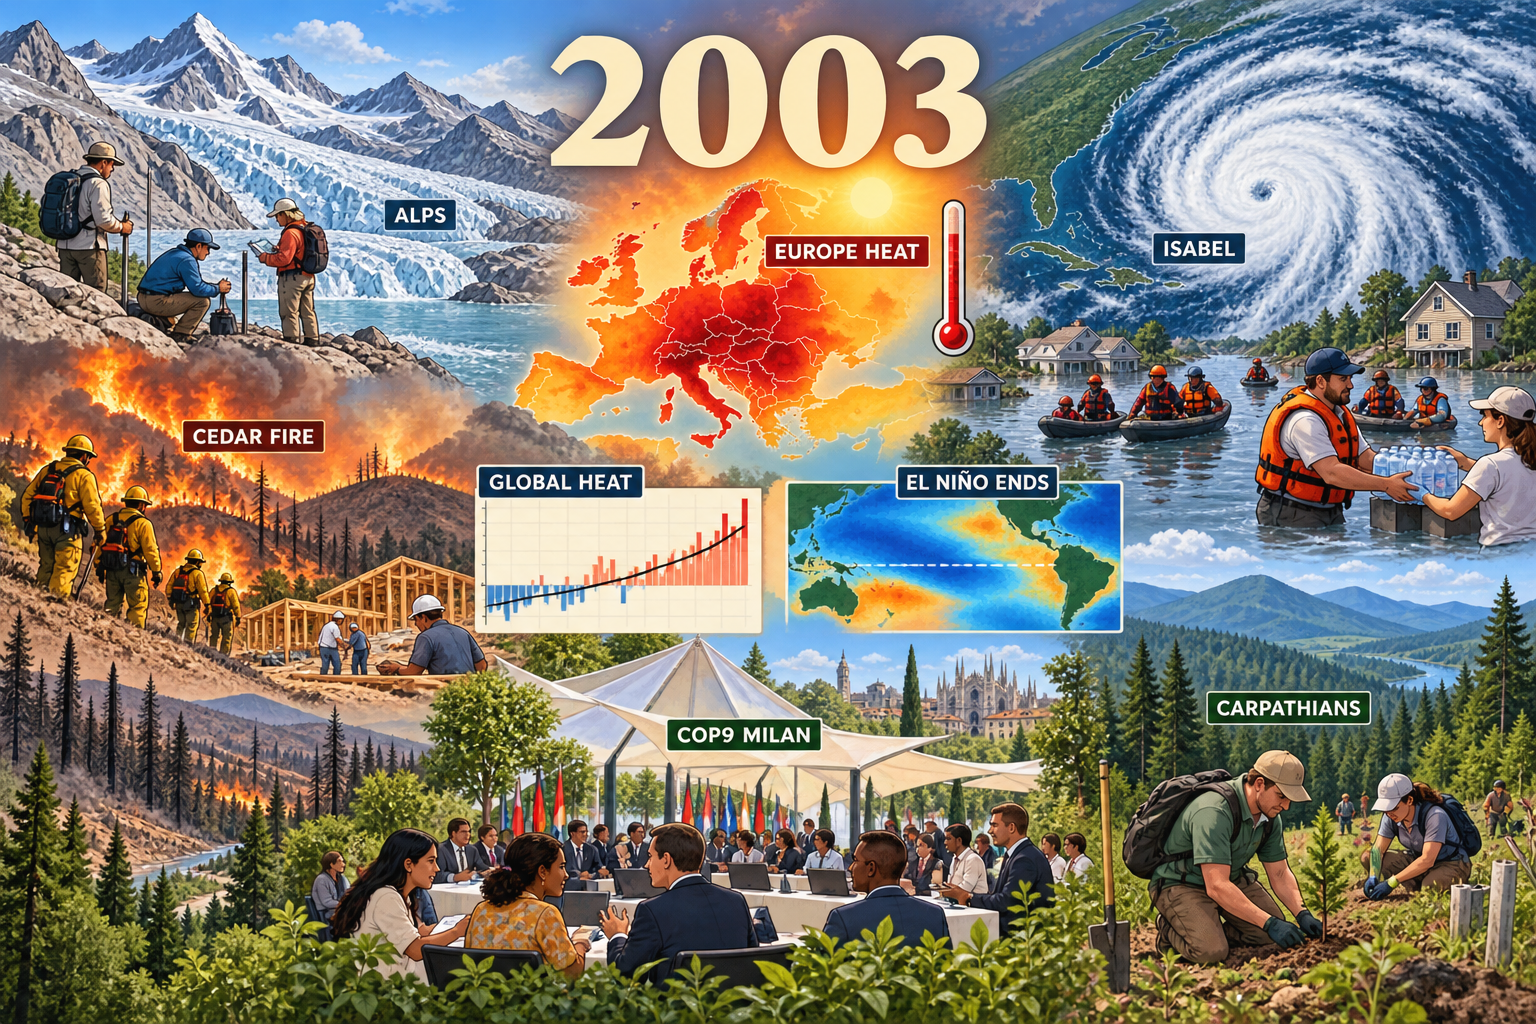
European heatwave and drought. The year's defining climate disaster is shown through a temperature map, thermometer, parched land and water distribution.
Climate & Weather Events: 2003
- Year: 2003
- Model: built-in gpt-image
- Generation date: 2026-10-17 (UTC)
- Saved image:
My-Library/Images/Collections/Climate-Weather-Events/Images/Climate-Weather-Events_2003.png
Selected moments, reasons and sources
- European heatwave and drought. The year's defining climate disaster is shown through a temperature map, thermometer, parched land and water distribution. NOAA describes exceptional heat and dryness from April through August; no casualty figure is printed. Source: https://www.cpc.ncep.noaa.gov/products/expert_assessment/europe_heat.pdf
- European forest fires and ecological impacts. Firefighters and a low-water landscape connect heat to forests, water and agriculture without injury imagery. Source: https://wedocs.unep.org/handle/20.500.11822/40942
- Exceptional Alpine glacier loss. Field researchers on exposed ice make the cryosphere impact visible. Source: https://wesr.unep.org/media/docs/assessments/loss_and_damage.pdf
- Hurricane Isabel. A large Atlantic spiral, coastal flooding and responders represent the storm; NOAA reports landfall near Drum Inlet and extensive storm-surge flooding. Sources: https://www.nhc.noaa.gov/archive/2003/dis/al132003.discus.051.shtml and https://www.nhc.noaa.gov/archive/2003/tws/MIATWSAT_sep.shtml
- Above-normal Atlantic hurricane season and five-day forecasting. NOAA reported 14 tropical storms, seven hurricanes and three major hurricanes, and identified 2003 as the first year of operational five-day track and intensity forecasts. The forecast desk was requested but omitted from the final render. Source: https://www.nhc.noaa.gov/news/NOAA_pr_12_1_03.html
- Southern California Cedar Fire. A distant fire line, firefighters and rebuilding show hazard and recovery; the illustration does not print casualty or damage figures. Source: https://www.fire.ca.gov/incidents/2003/10/25/cedar-fire
- High global temperature. A modest chart labeled GLOBAL HEAT represents NASA GISS's contemporary ranking of 2003 as third warmest in its instrumental record at that time. Source: https://data.giss.nasa.gov/gistemp/news/2003/
- The 2002–03 El Niño dissipated. A small Pacific map provides climate-system context without attributing every event to ENSO. Source: https://repository.library.noaa.gov/view/noaa/17458
- COP9 in Milan. The delegate pavilion represents decisions on climate impacts, adaptation, observing systems, and afforestation/reforestation under the Clean Development Mechanism. Source: https://unfccc.int/cop9/
- Carpathian Convention established. Conservation workers and a forest corridor balance hazards with a durable regional protection story. Source: https://www.unep.org/news-and-stories/story/europes-wild-carpathian-mountains-prospect-drought-rises
Balance and tone
Heat, hurricane, wildfire and glacier impacts are balanced by climate monitoring, forecasting, international policy, forest conservation, response and rebuilding. No disaster figures are printed in the image, and no gore, bodies, injuries or panic are shown.
Readable labels
2003; EUROPE HEAT; ALPS; ISABEL; CEDAR FIRE; GLOBAL HEAT; EL NIÑO ENDS; COP9 MILAN; CARPATHIANS.
Final prompt used
Regenerate the 2003 Climate & Weather Events entry in the same polished cartoon-editorial science-magazine style as the 2000–2002 siblings, correcting the edge-crop defect. Compose natively as a 3:2 landscape and KEEP EVERY REQUIRED LABEL AND IMPORTANT SUBJECT INSIDE THE CENTRAL 75% OF THE CANVAS, with broad text-free scenery at both side edges. One unified environmental-editorial landscape, clean dark linework and rich painterly detail. Large readable ivory "2003" top center. Prominent central anchors: a Europe heat-anomaly map with thermometer and label "EUROPE HEAT"; Hurricane Isabel satellite spiral over the U.S. East Coast labeled "ISABEL" beside calm flood responders; and a meteorology desk with generic scientists and a track cone labeled "5-DAY FORECAST". Supporting scenes, all labels fully inside safe margins and spelled exactly: retreating Alpine glacier with scientists, "ALPS"; Southern California firefighters, distant burn scar and rebuilding, "CEDAR FIRE"; modest temperature chart, "GLOBAL HEAT"; small Pacific map, "EL NIÑO ENDS"; diverse delegates in an open pavilion, "COP9 MILAN"; mountain-forest conservation workers, "CARPATHIANS". Show volunteers distributing water during drought, firefighters on safe lines, flood response boats, scientists measuring ice, rebuilding and tree planting. Palette of storm slate blue, heat orange and crimson, smoke amber and ochre balanced by glacier cyan, forest green and recovery-sky blue. Integrate maps and charts into one shared terrain and atmosphere rather than panels or stickers. Serious but hopeful. Short high-contrast labels only; absolutely no lettering in the outer 15% edges so a 3:2 center crop cannot clip text. No gore, bodies, injured people, panic, disaster spectacle, exact logos or agency seals, photorealistic real-person likenesses, fake paragraphs, watermarks, signatures or borders. Faces remain visibly illustrated with simplified features and soft cel shading.
QA
Viewed against 2000–2002. Passed: readable year and nine labels; prominent European heat, Isabel, Cedar Fire and global-temperature science; policy, conservation, response and rebuilding balance the hazards; no gore, injury, panic, real-person likeness, logo, watermark or border. The first render was rejected because 3:2 normalization clipped CEDAR FIRE. The retry landed natively at 1536×1024 and corrected the crop defect. Minor recorded defect: the requested five-day forecast desk and label were omitted, though the saved image still depicts nine distinct researched moments and satisfies the collection's 8–12 target.
More from Image Collections