Quarterly Net Worth Report
A rendered quarterly report that turns a list of account balances into a net-worth trend, a savings rate, and a distance-to-FIRE number, for anyone who tracks accounts in a spreadsheet but has never…

Quarterly Net Worth & Savings Rate Report
A rendered quarterly report that turns a list of account balances into a net-worth trend, a savings rate, and a distance-to-FIRE number, for anyone who tracks accounts in a spreadsheet but has never turned the numbers into a readable summary.
Date: 2026-07-28 Type: Report Theme: Net-Worth Status: Idea
What it is
A markdown report generated once a quarter from a simple account-balance ledger: cash, brokerage, retirement, and debt balances at the start and end of the period. It computes net worth, quarter-over-quarter change, an 8-quarter trend, a savings rate, an asset-allocation breakdown, retirement-contribution pacing against the current year's IRS limits, and progress toward a 25x-expenses FIRE number.
Who it serves
Someone who already tracks account balances somewhere (a spreadsheet, a budgeting app's account list, an aggregator export) but has never turned that raw data into a single readable snapshot. The target reader wants the "how am I doing" answer without opening seven tabs and doing the subtraction themselves.
The money problem it addresses
Net worth is easy to track and easy to leave uninterpreted. Most people who log balances stop at the spreadsheet: a column of numbers with no trend line, no savings-rate calculation, and no sense of how a quarter's contributions compare to the annual retirement-account limits. This report does the arithmetic a person would otherwise skip: the 8-quarter trend that shows whether a bad quarter was noise or a pattern, the savings-rate formula applied consistently period to period, and the reminder of how far $2,400 into a Roth IRA sits from the $7,500 annual cap.
How it works
The data layer (a script, a spreadsheet export, or a Plaid /accounts/balance/get pull) supplies one JSON object per quarter: start/end balances for each asset and liability, the prior 7 quarters of net-worth totals, take-home pay and contribution amounts for the period, YTD retirement contributions, and the reader's stated annual expenses. The template renders that into an executive summary, a full balance sheet with a start/end/change column, an ASCII-bar 8-quarter trend, a savings-rate calculation, an asset-allocation bar chart, a retirement-contribution-pace table against the current year's 401(k)/IRA limits, a debt-to-asset ratio, and a 25x-rule FIRE-progress line. Every number in the rendered version comes from the same JSON shape the template expects; nothing is computed by the reader.
What's in this folder
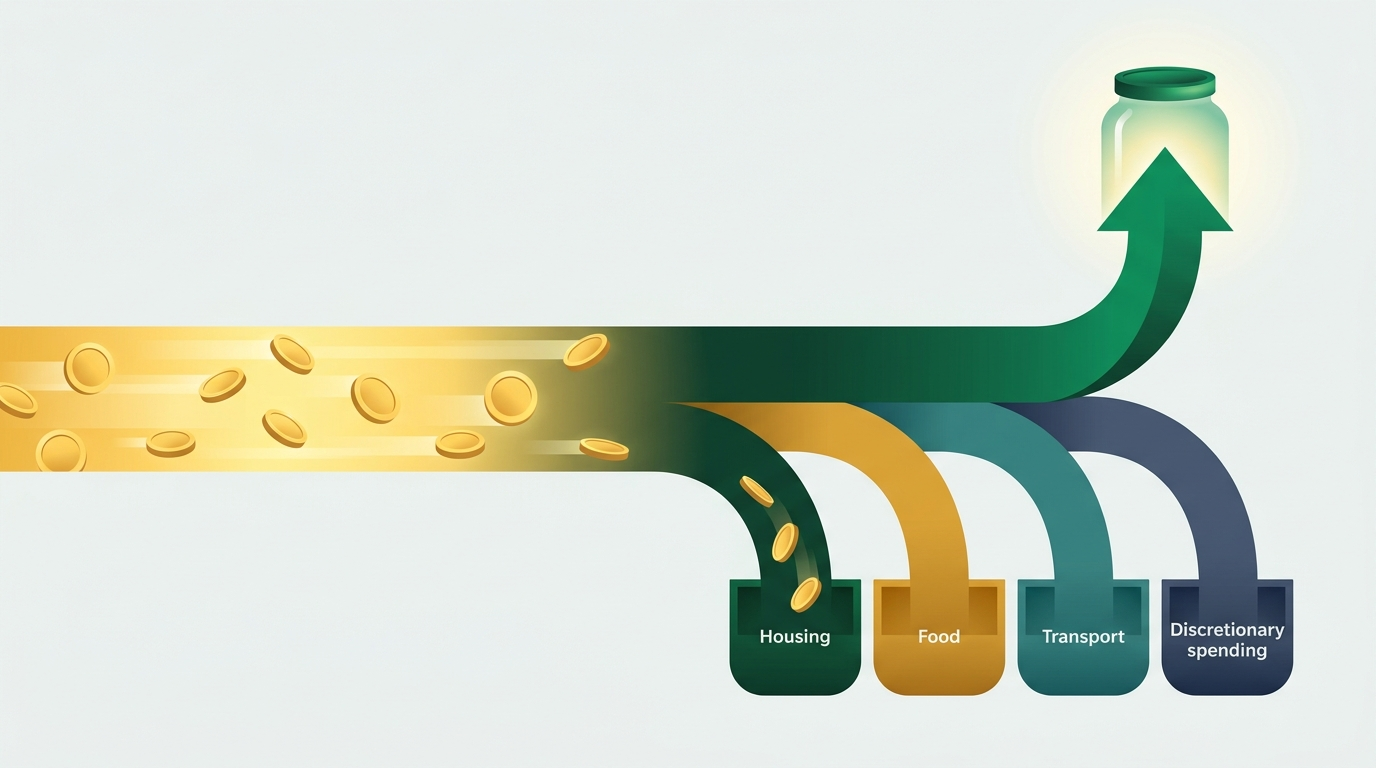
report.md— the fully rendered Q2 2026 report for a synthetic person ("Dana R."), with realistic account balances, an 8-quarter net-worth trend, and a retirement-contribution-pace table against the 2026 IRS limits.report-template.md— the same report with every value replaced by a{{placeholder}}, including{{#each}}loops over the asset/liability/contribution lists.sample-data.json— the synthetic dataset behindreport.md, shaped so every placeholder inreport-template.mdhas a matching field (balance sheet, quarterly trend, cash flow, retirement contributions YTD, FIRE target inputs).cover-image.png— cover art for this idea card.metadata.md— generation metadata for this run.
How to run / read it
Open report.md for the rendered version. See report-template.md for the placeholders a real data pipeline would fill in, and sample-data.json for the exact shape of the source data (dollar amounts stored as integer cents, per the repo's money-math convention). To adapt this for a real ledger, swap in your own account balances and take-home/contribution figures in the same JSON shape — the template does the rest.
Estimated impact
Turns roughly 20–30 minutes of manual spreadsheet arithmetic (summing accounts, computing a savings rate, checking contribution limits) into a report generated in seconds once the balance data exists. The concrete catch it's built to make visible: a Roth IRA contribution pace tracking toward $4,800 for the year when the limit is $7,500, a $2,700 gap that's easy to miss without a pace calculation and easy to close with a mid-year contribution bump if that's the right call for the reader's budget.
Good to know
This is an organizing and arithmetic tool, not personalized financial or investment advice. The FIRE-number and contribution-pace sections are distance markers, not a recommendation to change contributions, retirement timing, or asset allocation; that decision depends on the reader's full financial picture, which this report doesn't see. IRS contribution limits and account-specific rules change year to year, so verify the current year's limits before relying on the pace table for a real filing year.
Sources
https://www.irs.gov/newsroom/401k-limit-increases-to-24500-for-2026-ira-limit-increases-to-7500— 2026 401(k) contribution limit ($24,500) and IRA limit ($7,500).https://www.bogleheads.org/forum/viewtopic.php?t=420845— the 25x / 4%-rule FIRE-number shorthand, sourced from the Trinity Study, and its limitations as a planning tool.https://www.nerdwallet.com/investing/calculators/net-worth-calculator— net worth = assets minus liabilities, and what counts as an asset vs. liability.
More from Financial Ideas