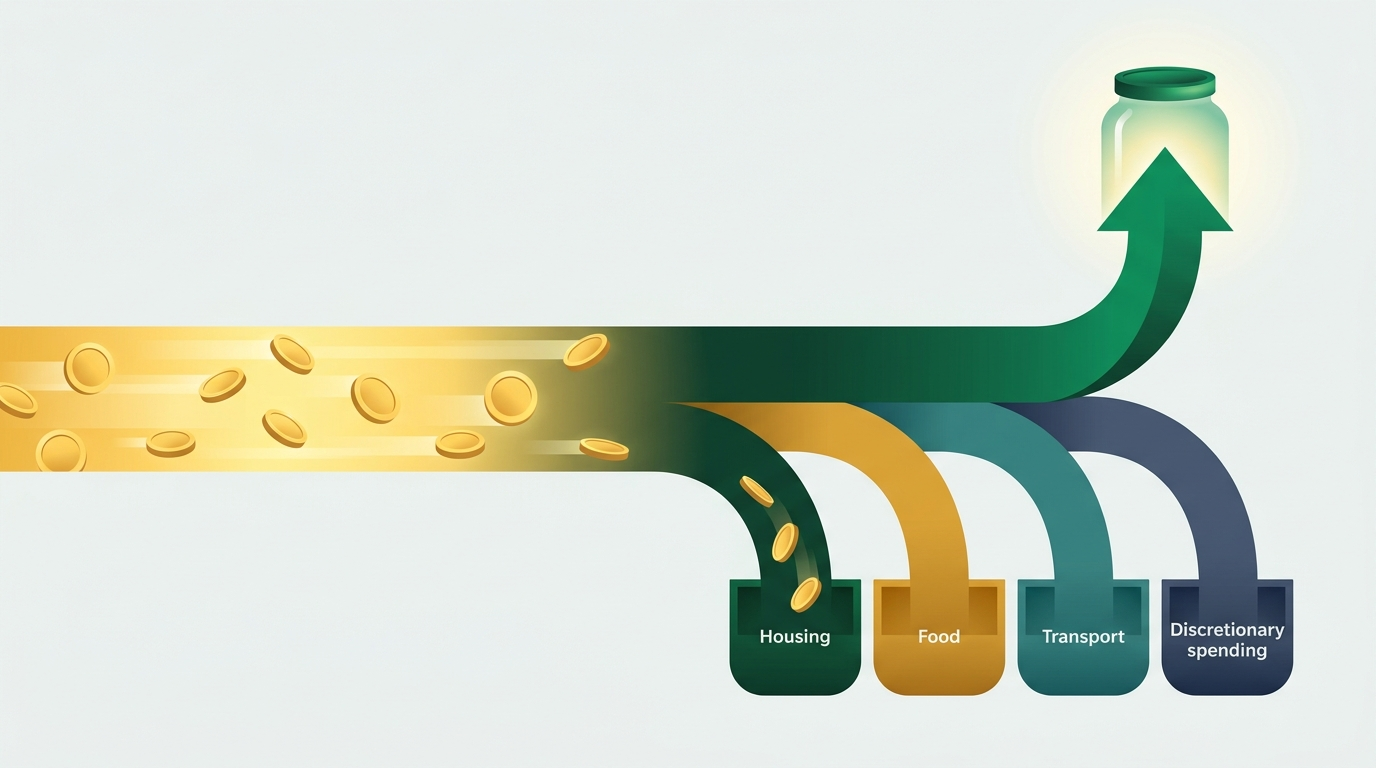
Debt Payoff Strategy Comparator
Side-by-side avalanche vs. snowball calculator — enter your debts and see instantly which method saves you more money and gets you debt-free faster.

Debt Payoff Strategy Comparator
Side-by-side avalanche vs. snowball calculator — enter your debts and see instantly which method saves you more money and gets you debt-free faster.
Date: 2026-07-14 Type: App Theme: Debt Status: Idea
What it is
A single-page browser app that takes your list of debts (name, balance, APR, minimum payment) plus any extra monthly payment you can apply, then runs both the avalanche (highest APR first) and snowball (lowest balance first) payoff strategies in parallel and displays them side-by-side. The output includes total interest paid, months to debt-free, total amount paid, and a Chart.js line chart showing how each strategy draws down your total balance over time. A payoff-order list shows exactly which debt each method eliminates first, and when.
Who it serves
Someone carrying two or more debts — credit cards, personal loans, store cards — who has heard of avalanche and snowball but has never seen the numbers computed for their specific situation. The tool answers the question every person in debt eventually asks: "Which method actually saves me more money — and by how much?"
The money problem it addresses
The average American carries $6,595 in credit card debt (WalletHub / ElitePersonalFinance, 2026), with the average interest rate on balances hitting 22.15% as of May 2026 (Federal Reserve). At those rates, even a modest difference in payoff strategy can mean hundreds of dollars in avoidable interest. The problem: most people pick a strategy based on what they read once, not on what's optimal for their specific mix of balances and APRs. Both methods are correct in principle; neither is universally best. Without a calculator that uses your actual numbers, it's impossible to know whether the difference is $50 or $600.
How it works
- Enter debts — the app pre-loads five synthetic example debts (representing a common multi-card scenario). Users can edit rows, add new ones, or remove any row.
- Set extra payment — users specify the monthly dollar amount they can put toward debt beyond the sum of all minimums (default: $200).
- Click Compare — the app runs both strategies month-by-month in integer-cent arithmetic (no floating-point drift). Each month it accrues interest on every active debt, applies minimum payments to all, then directs the extra pool (user extra + freed minimums from paid-off debts) to the priority debt: highest APR for avalanche, lowest current balance for snowball.
- Review results — a side-by-side card shows total interest, months, and total paid. A verdict banner names the winning strategy and quantifies the savings. A Chart.js line chart shows both payoff curves. A payoff-order list shows which debt each strategy eliminates first and in which month.
What's in this folder
README.md— this file: overview, problem statement, usage guide, impact estimate, sources.cover-image.png— editorial illustration used as the card cover in the web app.metadata.md— workflow provenance, model, cover prompt, file manifest.requirements.md— functional and technical requirements (bulleted, testable).index.html— single-page entry point; loadsstyle.cssandscript.js; requires only a modern browser.style.css— full visual design: layout, typography, strategy cards, chart wrapper, verdict banner, payoff-order list.script.js— all logic: debt-row management, integer-cent payoff algorithm for both strategies, Chart.js rendering, verdict copy.sample-data.json— five synthetic debts with metadata notes; the same values the app pre-loads on startup.
How to run / read it
Open index.html in any modern browser (Chrome, Firefox, Safari, Edge). No build step, no server, no API keys. The file can be opened directly from file://. The app pre-loads sample data; click Compare Strategies immediately to see results, or edit the debt rows first.
Estimated impact
The savings from choosing the better strategy depend entirely on the spread of APRs. When APRs are close together (e.g., two cards at 22% and 24%), the difference between avalanche and snowball is typically under $100. When APRs vary widely (e.g., one card at 28.99% and a personal loan at 12.75%), the avalanche method can save $200–600 in interest and cut 1–3 months off the payoff timeline on a $10,000–$15,000 balance. At 22.15% average APR, every extra month of carrying a $1,000 balance costs roughly $18.46 in interest — understanding which strategy eliminates the high-rate debts faster is directly worth that difference.
More broadly, simply knowing that any extra payment exists — and directing it systematically rather than randomly — shortens the payoff timeline dramatically. On a $5,000 balance at 22% APR, the difference between $0 extra and $100 extra per month can be the difference between 20 months and 34 months, saving over $700 in interest.
Good to know
This is an educational organizing tool, not personalized financial or investment advice. The calculations assume a fixed APR applied monthly (APR ÷ 12) and that minimum payments do not change as balances fall — real lenders may calculate minimums as a percentage of balance, which would alter the timeline. APRs used in the sample data are near July 2026 national averages cited by the Federal Reserve and LendingTree; actual rates on your accounts may differ. Verify your current APR on each statement before making payoff decisions. The avalanche method is mathematically optimal for minimizing total interest; the snowball method is behaviorally optimal for some people because early wins provide motivation — neither is wrong.
Sources
https://finance.yahoo.com/news/average-credit-card-debt-america-093800880.html— average U.S. credit card debt $6,580 per individual (ElitePersonalFinance / TransUnion data, 2026)https://wallethub.com/edu/cc/average-credit-card-debt/25533— average credit card debt per American, July 2026https://wallethub.com/edu/cc/average-credit-card-interest-rate/50841— average credit card interest rate July 2026 (22.21% new offers, 20.94% existing)https://www.lendingtree.com/credit-cards/study/average-credit-card-interest-rate-in-america/— LendingTree: average APR on new offers 23.79% as of July 2026https://www.newyorkfed.org/microeconomics/hhdc— NY Fed Household Debt and Credit Report: $1.252 trillion total credit card debt Q1 2026https://www.fidelity.com/learning-center/personal-finance/avalanche-snowball-debt— Fidelity: avalanche vs. snowball method comparisonhttps://www.nerdwallet.com/credit-cards/learn/what-is-the-average-credit-card-interest-rate— NerdWallet: average credit card interest rate citing Federal Reserve (21.52% Feb 2026)https://www.experian.com/blogs/ask-experian/avalanche-vs-snowball-which-repayment-strategy-is-best/— Experian: avalanche vs. snowball explanation and comparison
Requirements
Requirements — Debt Payoff Strategy Comparator
Functional Requirements
- FR-1 User can enter any number of debts via an editable table. Each row requires: account name (text), current balance (dollars), APR (%), and minimum monthly payment (dollars).
- FR-2 User can specify an extra monthly payment (dollars) applied beyond the sum of all minimums.
- FR-3 App computes the Avalanche payoff schedule: each month, after applying minimum payments to all active debts, the extra payment pool (user extra + freed minimums from fully paid debts) is directed to the debt with the highest current APR.
- FR-4 App computes the Snowball payoff schedule: same pool directed to the debt with the lowest current remaining balance.
- FR-5 Side-by-side summary cards display for each strategy: total interest paid, months to debt-free (formatted as years + months when ≥12), and total amount paid.
- FR-6 A verdict banner names which strategy saves more interest, states the dollar difference, and notes the month difference in payoff timeline.
- FR-7 A Chart.js line chart renders total remaining balance over time for both strategies on the same axes, with shared tooltip.
- FR-8 A payoff-order section lists debts in the order each strategy eliminates them, with the month number of elimination.
- FR-9 Sample data (five synthetic debts) is pre-loaded on first render. A "Load sample data" button resets all inputs to defaults.
- FR-10 User can add debt rows (blank) and remove any row. Rows missing any required field are silently skipped during computation.
Technical Requirements
- TR-1 Single-page app —
index.htmlopens directly fromfile://in any modern browser with no build step, server, or API keys. - TR-2 All monetary arithmetic uses integer cents (inputs multiplied by 100 and rounded) to avoid binary-floating-point drift. Dollar display is formatted at output only via
toLocaleString. - TR-3 External CDN dependency:
chart.js@4.4.7viahttps://cdn.jsdelivr.net/npm/chart.js@4.4.7/dist/chart.umd.min.js. No other third-party libraries. - TR-4 Payoff simulation loop includes a hard safety cap of 720 months (60 years) to prevent infinite loops when monthly payment cannot cover accruing interest.
- TR-5 Existing Chart.js instance is destroyed before re-rendering to prevent canvas memory accumulation.
- TR-6 Input validation: non-positive balance, non-positive APR, non-positive minimum, or empty name causes that row to be skipped silently; an alert fires only when zero valid rows remain after filtering.
- TR-7 HTML output in
renderPayoffOrderis constructed with string templates; user-supplied debt names are not injected intoinnerHTMLdirectly — they are injected into text-only<li>content to avoid XSS.
Non-Requirements
- No real account connections, OAuth flows, or third-party API calls.
- No persistent storage — session-only state.
- No server-side computation.
- No personalized financial, investment, or tax advice output.
- Does not model variable minimum payments (percentage-of-balance minimums used by some issuers).