Monthly Cash Flow Report
A parameterized monthly financial snapshot — income vs. spending by category, savings rate vs. U.S.
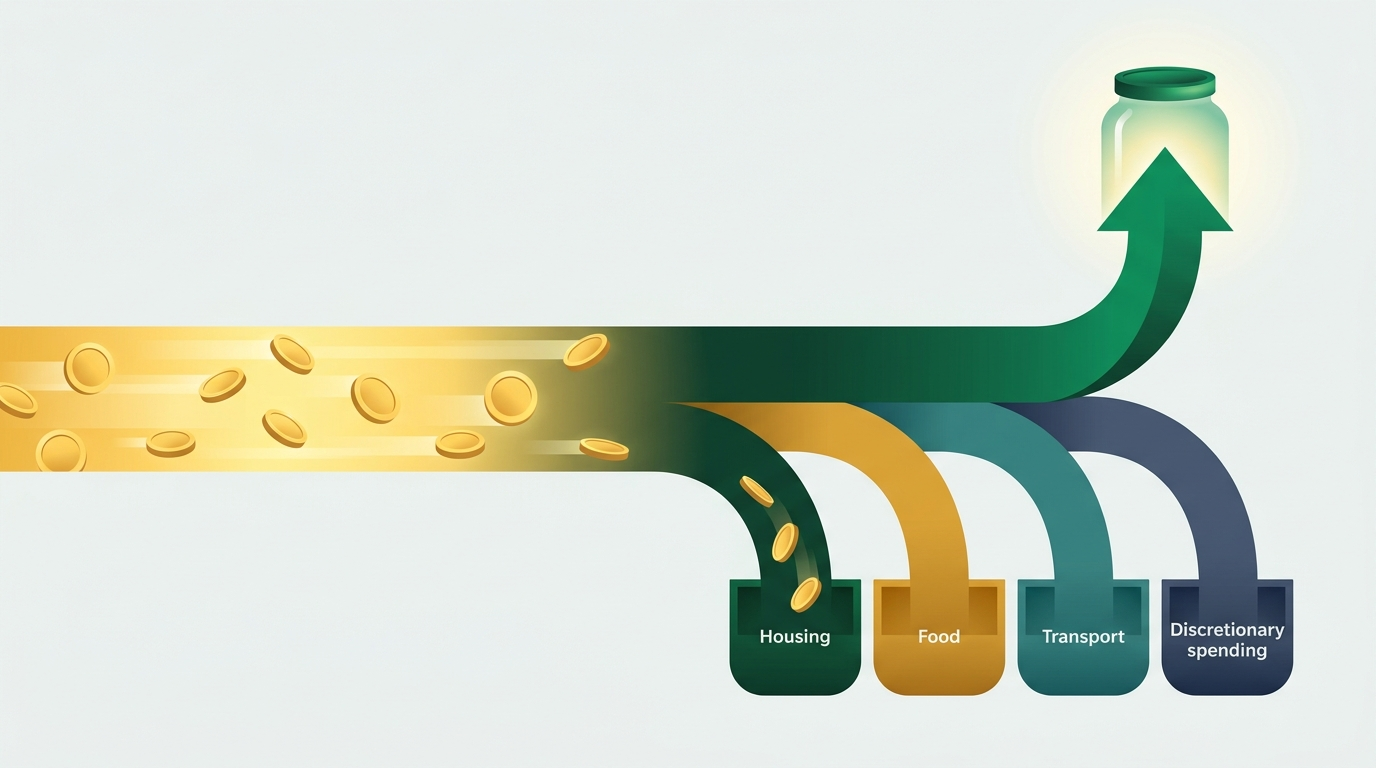
Monthly Cash-Flow & Savings-Rate Report
A parameterized monthly financial snapshot — income vs. spending by category, savings rate vs. U.S. benchmarks, and clear action items — for anyone who wants to see exactly where their money went and whether they're on track.
Date: 2026-07-07 Type: Report Theme: Budgeting Status: Idea
What it is
A ready-to-fill monthly report template that takes a person's income and spending totals (entered manually or imported from a bank-export CSV) and produces a clean, printable Markdown document. The rendered output shows category-level spending, a three-view savings rate (take-home transfers only; including 401k; including employer match), a one-line flag for any category above its guideline, and specific action items for the month. The report is deliberately plain Markdown — no app to log into, no spreadsheet to set up, no subscription.
Who it serves
Someone who has a general sense that they're "pretty good with money" but has never actually added up their monthly spending by category, computed their savings rate, or compared it to a real benchmark. Also useful for anyone coming off a high-spend month (holiday travel, home repair, medical bill) who wants a one-page accountability document before the next month starts.
The money problem it addresses
The U.S. personal savings rate was 3.0% in May 2026 (BEA via FRED) — well below the commonly cited 20% minimum and far below the 50% FIRE target. Most people can name their rent but not their total monthly spend. Without a concrete number — "I spent $2,960 and saved 23.5% of gross income" — the decision to bump a 401k contribution, sweep a checking buffer to a high-yield savings account, or cut a spending category stays abstract. This report converts a month of transactions into a single, scannable page with specific, dollar-denominated next steps.
How it works
- Gather your numbers. Export a month of transactions from your bank/credit card (CSV), or tally spending per category manually. Populate
sample-data.jsonwith your actual figures (or copy the synthetic sample and edit in place). - Open
report-template.md. Substitute each{{PLACEHOLDER}}with the matching value from your data. Array rows (spending categories, savings transfers) expand one row per item. A simple find-replace in any text editor handles this in under five minutes; a short Python script can automate it if you run the report monthly. - Review the rendered report (
report.mdis the pre-filled example). The report surfaces: total spending vs. income, the three savings-rate views, a per-category percentage + guideline flag, an ASCII bar chart of category weights, and a "what's working / watch list" section derived from your numbers. - Act on the action items. Each flagged item (e.g., housing above 30%, unallocated buffer in checking) includes a specific dollar-and-rate suggestion — not a generic tip.
What's in this folder
README.md— this filecover-image.png— illustration for the library card viewmetadata.md— workflow sidecar (type, theme, model, prompt)report.md— the rendered example report with realistic synthetic numbers for "Sarah T." (June 2026)report-template.md— the parameterized version with{{PLACEHOLDER}}markers and a full placeholder-to-JSON-field reference tablesample-data.json— the synthetic dataset that the rendered report is built from; matches every placeholder in the template
How to run / read it
Open report.md for the rendered example — it reads like a finished report and is the best starting point. Then open report-template.md to see how every number maps to a {{PLACEHOLDER}}. Finally, read sample-data.json to understand the shape of the data layer — replacing the synthetic values with your own figures produces your personalized report.
To automate monthly generation, a short Python script (not included here) can read sample-data.json and render report-template.md by substituting all placeholders and expanding the spending/savings arrays — roughly 40 lines with no dependencies beyond the standard library.
Estimated impact
For someone with an unallocated checking buffer of $1,000, moving it to a HYSA at 4.10% APY instead of leaving it at 0.38% earns ~$37 more per year — trivial on its own, but the report's real value is the habit: people who track monthly savings rates measurably increase them. Research cited in NerdWallet's budgeting guides suggests that regular monthly budget reviews are the single strongest predictor of savings-rate improvement, independent of income level. Even moving a savings rate from 3% (U.S. average) to 20% on a $55,000 take-home salary means an additional $9,350 saved per year.
Good to know
This report is an organizer and estimator — it is not personalized financial, investment, or tax advice. The savings-rate benchmarks (20% minimum, 50% FIRE target) are widely cited rules of thumb, not prescriptions. The U.S. average savings rate (3.0%, May 2026) comes from the Bureau of Economic Analysis via FRED and will change month to month. HYSA rates (4.10% APY, July 2026) are the top published offers — your rate may differ; verify current rates at Bankrate or NerdWallet before acting. All sample data is synthetic.
Sources
- U.S. personal savings rate May 2026 (BEA via FRED): https://fred.stlouisfed.org/series/PSAVERT
- Average American monthly expenses by category (Ramsey Solutions, 2026): https://www.ramseysolutions.com/budgeting/american-average-monthly-expenses
- BLS Consumer Expenditure Survey — housing and transportation at 50% of household spending: https://www.bls.gov/opub/ted/2026/housing-and-transportation-accounted-for-50-percent-of-household-spending-in-2024.htm
- Top HYSA rates (Bankrate, July 2026): https://www.bankrate.com/banking/savings/best-high-yield-interests-savings-accounts/
- How to calculate your personal savings rate (Fidelity): https://www.fidelity.com/learning-center/personal-finance/savings-rate-calculation
- Housing 30% guideline (NerdWallet): https://www.nerdwallet.com/article/mortgages/how-much-should-you-spend-on-housing
- Savings rate calculation and why it matters (ChooseFI): https://choosefi.com/spending-smarter/how-to-calculate-your-savings-rate
- State of Personal Finance in America Q1 2026 (Ramsey Solutions): https://www.ramseysolutions.com/budgeting/state-of-personal-finance